I went to the Suns game yesterday (vs Philly) with my buddy Walter. He has owned Suns season tickets since the Steve Nash era, the last time the local team was a championship caliber team, besides last year. I usually drive to these games, and they’re most always at night, but yesterday Walter graciously drove and it was an afternoon game. Now, why does this matter, and what’s it got to do with real estate?
Glad you asked.
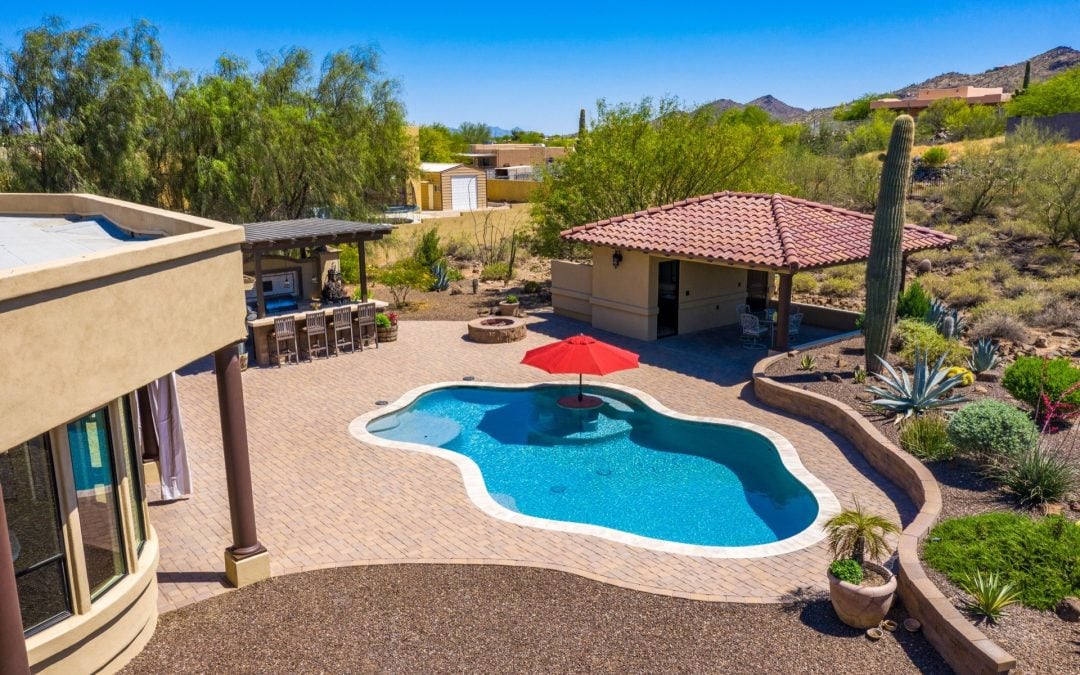
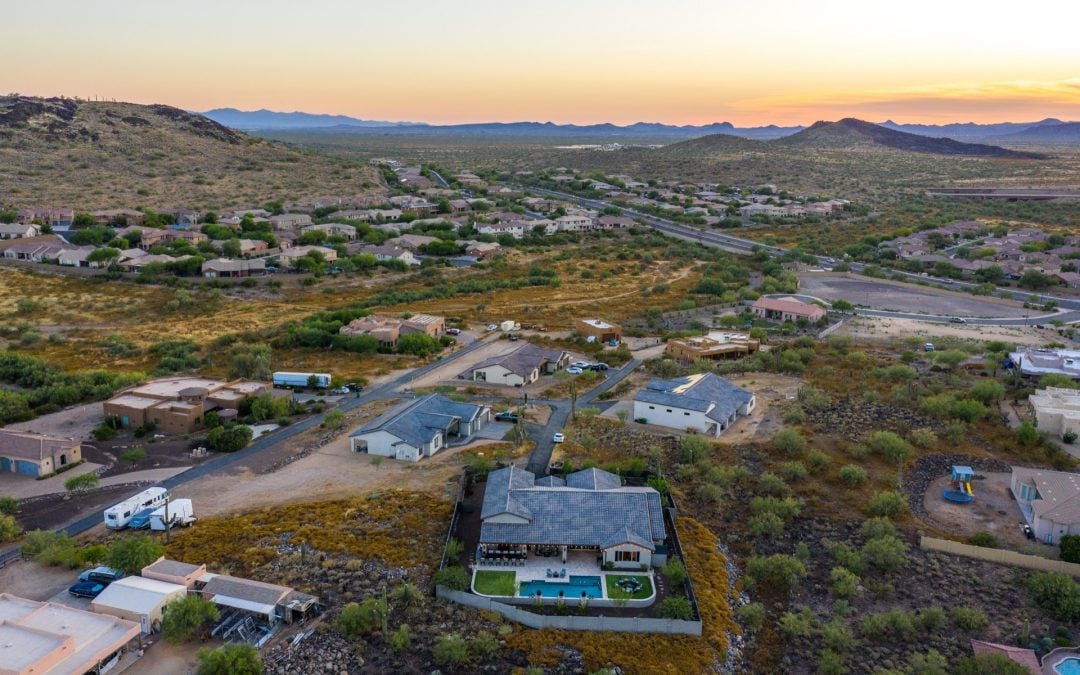
Not driving, and being able to be an observer, I was blown away with the upward growth (literally) of downtown Phoenix. Numerous high-rise cranes were building modern commercial and residential structures. Former run-down neighborhoods (not all) were sprouting economic vitality. The arena (Footprint Center) was like no other arena event I’ve ever attended. It was a sellout (and it’s not even the playoffs) and the fan/arena noise was an amazingly fun assault on the senses. Of course, it does help to have the best pro team in the nation😉
Segue.
“…the Phoenix Metro community as a whole, saw more population growth than any other metro community…”
According to Census data, Arizona’s population gained almost 100,000 this past year. And 99% of our resident growth is attributed to migration, rather than the “natural change” of births and deaths. Of the 98,330 new residents, only 832 were attributable to natural change. Check out this article from the Business Journal:
Maricopa County alone, added more residents (58,246) than any other County in the country. Further, the Phoenix Metro community as a whole, saw more population growth than any other metro community, behind only Dallas-Fort Worth-Arlington area. Arizona ranks, per the Census, as the 3rd fastest growing state in the U.S.
What was just a few years ago never really discussed, but is now the most oft question of the day for The Bodeen Team:
When will this (price escalation) end? Based on the above local and statewide story, not real soon. Seemingly, our demand for a limited supply of housing will continue unabated for the foreseeable future. This will further increase values locally, and statewide.
Caveat: Having said that, in 46 years of residential real estate experience, I’m no stranger to market changes. And when they happen, they can happen quickly.
I haven’t seen any other articles about this yet, but the counter-intuitive conclusive message, at least now, seems to be getting clear: Global and national bad news, at least in Phoenix, Arizona, means home values continue spiking upward.
Some history:
Pricewise, in August of 2011, based on the Monthly Average Sales Price Per Square Foot, (PSF) the Phoenix Metro residential real estate market hit rock bottom – $79.00 PSF. This was a time which local veteran real state agents would just as soon forget. Foreclosures, Short Sales, abandoned homes, many displaced families, it was a nightmare.
But then, the market turned. Investors began buying homes traditionally and the through the foreclosure market, fixing and flipping, or fixing and renting. Gradually, neighborhoods began to change – for the better. Between that August 2011 bottom and February of 2020, the PSF rose to $185. This was a $106 PSF rise in 9 years, or $12.00 PSF per year average. If you had a 2000 SqFt home, your home appreciated $24,000 per year. Wow, a great time to own a home.
In February of 2020, the Covid 19 reality began hitting home. The local market screeched to a halt. In two months, the PSF dropped $7.00. Listing inventory rose by over 30% in one month! At this rate we would be soon seeing a return to a huge inventory of homes for sale. The pandemic increased intensity and hundreds of thousands of Americans were dying, not to mention the millions world-wide. The great and healthy 9-year real estate ride we homeowners were enjoying, was ending – at least that’s what we “experts” thought.
The great and healthy 9-year real estate ride we were all enjoying, was ending – at least that’s what we “experts” thought.
But then, inexplicably, unexplainably, incredulously, the market changed – again. We went from $180 PSF in May of 2020 to $296 in March of 2022 – in less than two years! That’s $116 PSF, or more than $58 PSF per year! That 2,000 SqFt home has now increased over $116,000 each of the last two years.
That was Covid-19. As this terrible pandemic has been winding down, we have a new war in the world with Russia and Ukraine spiraling up. It has World War potential. Oil, the still major global currency, has spiked, bringing with it inflation not seen in our country since the 80’s. Mortgage rates are also rising, now over 4%.
Are these new geo-political events halting the rise of local real estate values? No! Incredibly, prices are continuing to rise ata greater rate as is now being reported by the Cromford Report, the most accurate source of real estate statistical reporting in Arizona.
So here’s the scoop:
Per Cromford, last month, on February 15th, the closed sales PSF for the Phoenix Metro area for all types, namely single family detached, condo/townhome, etc., was $277. On March 15th, the closed sales PSF was $290 – an increase of 4.5% – in one month. That used to be Phoenix’s annual long term appreciation rate!
I’m not through. As of March 15th, the current average Pending Sales PSF is at $296. Based on current Pending PSF, Cromford is projecting a 4.4% rise for April 15th. If this happens, prices will have risen 9% in just 2 months, or an annual rate of 54%!
My conclusion? It seems simple enough. In the storms of life, people gravitate to what is solid and real. And recently at least, it seems like folks aren’t letting go.
Last week, a client and friend emailed me a great and timely question, and yesterday the answer came. First, his question:
“Hello Mike, Obviously buying anything now is anything but easy, but are there any areas…of town whose prices haven’t gone as far to the moon as the rest or is it all equally bad?”
His question is probably on the minds of many these days. So, we look to Cromford’s Ranking Table published yesterday, March 13th, 2022 which ranks the 40 cities of Phoenix Metro. The Annual Average Price Per Square Foot (PSF) is what is compared with the previous PSF at the same time last year. It is ranked from highest PSF to lowest. Important to note is that these ranked homes are single family detached – not condo, townhouse, etc.
What sticks out to me is, and has been no surprise for many years, is the Northeast Valley, which is the highest priced geographical quadrant in Metro Phoenix. Paradise Valley, one year ago had a PSF of $471 (numbers rounded). It rose 30% to $613 presently – a 30% increase. Scottsdale follows with a 29% PSF increase ($410 vs $318). Carefree, Rio Verde (NE Scottsdale), Fountain Hills and Cave Creek round out the top 6 cities – the only cities priced over $300 PSF – all rose over 25%!
The other non-surprise is that many of the most affordable cities per PSF, are those located out of town. Seven more distant cities that are priced under $200 PSF are those further out. Interestingly, the two highest PSF increases were out there in Coolidge and Tonopah – at 40% and 42% respectively.
Oh yea, Tonopah, (aka East L.A.) is near the place that Bill Gates guy bought 25,000 acres in 2017 to develop a “Smart City” known as Belmont. Oh, and isn’t that area right near the proposed Interstate 11 which will traverse from Mexico to Canada some century? Hmm.
Our market is providing mixed messages. Here are the basic numbers as reported by the Cromford Report last week comparing March 1, 2022 and March 1, 2021 forall areas & types:
Active Listings: 4,588 vs 4,491 last year – up 2.2% – but down 5.9% vs 4,876 last month
Under Contract Listings: 12,050 vs 12,630 last year – down 4.6% – but up 6.6% vs 11,302 last month
Monthly Sales: 8,000 vs 8,035 last year – down 0.4% – but up 12.7% vs 7,096 last month
Monthly Average Sales Price per Sq. Ft: $285 versus $231 last year – up 23.1% – and up 3.6% from $274.70 last month
Monthly Median Sales Price: $445,000 vs $349,000 last year – up 27.5% – and up 2.7% vs $433,500 last month
Days of Inventory: 17 vs 16 last year vs 39 two years ago
First off, the supply of active listings, though up 2.2% from one year ago, fell 5.9% from last month. This limited inventory continues to spell bad news for buyers. Under Contract Listings dropped 4.6% compared to last year but were up 6.6% from last month. Sales dropped slightly from last year but were up a whopping 12.7% compared to last month.
And for those hoping there would be moderation in pricing, it’s not happening yet. The average monthly sales price per square foot (PSF), now at $285 PSF, was up (just?) 23.1% from last year, but launched upward 3.6% since last month. Calculating that on an annualized basis, that would be an increase of 43%. The monthly median sales price was up 27.5% from one year ago, and up 2.7% since the previous month – an annualized increase of 32%.
Rental Market Showing Signs of Softening?
Cromford reported over the weekend that the ARMLS (Arizona Regional MLS) rental supply has increased 39% compared to one year ago. (1543 to 2138 units) It should be noted that most rentals do not appear on ARMLS, but the numbers are significant enough to look at trends.
Supply is arriving faster. New rental listings are up 20% compared to 2021. In the last 4 weeks alone, there has been a 26% increase in new rental listings. The average lease list price shows a drop of $1.80 PSF from $1.93 one year ago. Single family detached homes to rent are up 99% – a significant increase, but apartments to rent are down 33%
Cromford further notes that the most likely supply of single-family homes to buy could come from wary investors finding it more difficult to rent the homes. This could happen if they’re finding it difficult to get tenants or the rent pricing falls.
On the other hand, the latest ARMLS PSF for places actually rented has now hit a new record of $1.38.
The shortest calendar month of the year closes today and we’re expecting temps in the low 80’s! Good Day Arizona! Chamber of Commerce weather is upon us – at least for a few days.
Well let’s start with a warning. You may see the local news shortly report on news that sells: Yes, that news, in their mind, bad news. Here’s the headline:
Maricopa County Pending Foreclosures Rise 51% in One Month!
True? Yes. Per our impeccable reporting source, the Cromford Report, there are currently 737 pending foreclosures in the county. Last month there were 488 that were pending. That is indeed a 51% increase.
Here’s the non-spin: For some perspective, please observe that last moth we had our lowest level of foreclosures ever!Our highest pending foreclosures on record in the county going back to the grossly memorable year of 2009 was over 51,000 pending foreclosures!
Will these pending foreclosures go to foreclosure sale? Some will. Most not. The worst-case scenario for most of these owners is that they will sell the home and put cash in their pocket due to the amount of equity gained by recent appreciation. The danger for these homeowners is that they may feel like they have to yield to an immediate low-ball offer from investors to buy their home. We cannot stress enough for sellers to get 2-3 opinions from “reputable” and “experienced” Realtor professionals. Hey, that would be us😉!
Well today is the near Ultimate Twosday, 2-22-22. I suppose the ultimate, ultimate Twosday would be 2-22-2222. But, hey, this is close enough.
So here’s your Bodeen chuckle for the week. Let’s go back to 1969, with that one hit wonder from Zager and Evans: “In the Year 2525.”
Enjoy:
Now I’m not implying that our market will reach “normal” in 200 or 503 years, but it won’t be anytime soon, either. We’re showing two charts today with converse directions: The Greater Phoenix Metro current market “median sales price,” and “Days of Inventory.”
First we’ll look at our current median sales price:
According to the Cromford Report, our Median Sales Price continues to rise to a present day $445,500, which is up from $350,000 one year ago – a 27% increase. Will this change? Yes, it will, but the change will look like 2001 to 2004, where there was a 21% change – over three years — or, 7% per year. And it could take a while to commence that line. 6 months? A year? Longer, before that modest annual increase sets in?
Can we begin to see when the market will change? Yes. “Days of Inventory” is probably the best leading indicator we have of a changing market.
Our market will change in favor of buyers as the days of inventory increase. As listings stay on the market longer, this will work in tandem with increased listings on the market, bringing greater supply. Supply must increase! Supply can of course increase due to a number of factors, such as pricing and mortgage rates getting too high. Affordability, or lack of it will bring more listings.
Also, having worked in this industry since the creation of dirt, I’ve seen a few things. Historically, when prospective home sellers believe that that market has hit it’s peak, they will put their home on the market to try and catch the top. This is truer of investors which currently own over 200,000 rentals in Phoenix. If major corporate rental owners liquidated their holdings, we’d see a mass market shift. That will not happen. Investors (landlords) saw rents rise in the 20% plus range. And the rental market is as tight as the buying market. They’ve got a hugely good gig going. Investors are still buying.