by JONATHAN BODEEN | Mar 9, 2015 | Bodeen Team Blog, Buying a Home, North Scottsdale News, Real Estate News
Last week my dad talked about the upward trends in the rental market. Well since then the numbers have been getting even crazier, almost to the point of jaw-dropping! What is especially interesting is the huge demand for traditional single family homes. Now be forewarned, we only can track rentals that are advertised through the MLS, which here in Maricopa County is probably less than half of all the rentals available. The rest are marketed through places like craigslist or rentals.com. Still, we can get a pretty good idea of what’s going on in the rental market by watching the MLS numbers.
This time last year there were 2,760 listings available. Today there are only 1,988. That’s almost a 30% drop in the available supply. On top of that, Rental prices are surging. The average rental price on MLS this time last year was $1,598. Today it is a whopping $1,971! That’s about a 20% increase in value!
Summary: Landlords be feeling good! Tenants… not so much.
What does this mean for homeowners and potential buyers? A lot. With only a 25 day supply of available rentals in the valley, increasing demand for single family homes to rent, and rental prices surging, it’s not difficult to imagine a whole host of would-be-renters drawn toward becoming a buyer. We have already seen an improvement in the residential for sale market in the last month, but we feel even better times may be ahead.
Sellers: The buyer drought seems to be over for now and it may be time for you to get back in the game.
Buyers. Increase in demand and decrease in supply makes for rising prices. Don’t forget that with an improving economy interest rates rise as well. It seems as though the best days of the buyer’s market may be nearing its’ end. You may want to think about making your move before the sellers’ market is in full swing and you have to start competing with other buyers again.
Thank you to Michael Orr and the Cromford Report for all the statistics used here in.
by MICHAEL BODEEN | Feb 2, 2015 | Bodeen Team Blog, North Scottsdale News, Real Estate News
For most of the nation, the holidays ended after New Year’s, but in Arizona, especially the Phoenix Metro communities, the party continued unabated through January, and ended yesterday with a Patriots interception in Super Bowl XL1X with 19 seconds left on the clock. Or did it end in a slugfest? Either way it ended and will go down as one of the great Super Bowls of all time. And in my opinion, it was a week (actually a month) that saw Phoenix and Arizona positively elevated by the glow of Super Bowl publicity.
It’s difficult (at best) to actually gauge all the benefits that will accrue to the Valley and State from the events of this past month. Is golf your thing? Well, not only can you play here in the dead of winter, but the Phoenix Open had some of its cooler temps and light rain Friday and Saturday but it still trumped most all other weather in the U.S. and had Tiger Woods and Phil Mickelson (for Thursday and Friday anyway), and then Sunday’s warmth and sunshine climaxed a great finish, and timed the ending perfectly to switch over to the Super Bowl.
Are cars or horses a great love for you? Well, if so, the month of January would have pleased with the Arabian Horse show and the Barrett Jackson Car auction/event in North Scottsdale. And just as the football season ends, here comes baseball and spring training that will be starting up shortly.
And if you’re living here, whether it be as a snowbird or permanent resident, there are so many incredible great eateries and resorts, arts and sports throughout the valley to enjoy. And our people, including visitors, are a proverbial smorgasbord of niceness. And of course, the beauty of the Sonoran desert is amazing.
Regarding our local housing market, this type of continuous and positive national media coverage serves to reinforce a terrific and high quality place to live. Make no mistake, companies and prospective residents will continue to be checking us out. And as my baby boomer generation continues to age, many will want to age in warmth and recreation. And judging by what I’ve been observing recently with out of town buyers, they are liking what they see – and feel.
Do we have issues? Of course. All places do – welcome to humanity. But more important, welcome to a place that seems to really be learning how to provide folks with a Super lifestyle.
by MICHAEL BODEEN | Nov 1, 2014 | North Scottdale Zip Code Information, North Scottsdale News, Real Estate News
85254 – Zip Line Report
Active and Pending Listings are virtually unchanged from one year ago. Sales are down while the median price has risen 10%.
Currently Last Year Change
Active Listings: 256 vs 257 Down Negligibly
Pending Listings: 38 vs 36 Up Slightly
Sales Per Month: 61 vs 63 Down Slightly
Sales Per Year: 716 vs 932 Down Significantly
Median Price: $425k vs $385k Up Significantly
85255 – Zip Line Report
This premier North Scottsdale zip code is showing active listings up and Pending listings down. Sales increased this last month versus last year, but are down 17% from last year.
Currently Last Year Change
Active Listings: 563 vs 468 Up Significantly
Pending Listings: 46 vs 69 Down Significantly
Sales Per Month: 71 vs 68 Up Slightly
Sales Per Year: 861 vs 1,036 Down Significantly
Median Price: $637k vs $617k Up Slightly
85258 – Zip Line Report
Including the Ranches of McCormick, Scottsdale, and Gainey, listings are down 11% over last year, while the median price is showing an 8% gain over 2014.
Currently Last Year Change
Active Listings: 127 vs 154 Down Significantly
Pending Listings: 13 vs 22 Down Significantly
Sales Per Month: 35 vs 29 Up Slightly
Sales Per Year: 385 vs 410 Down Significantly
Median Price: $500k vs $465k Up Significantly
85259 – Zip Line Report
Listings are up 15% from last year, while Pending listings are the same. Annual sales are lower as well and the median price has dropped 10%.
Currently Last Year Change
Active Listings: 242 vs 211 Up Significantly
Pending Listings: 21 vs 21 No Change
Sales Per Month: 34 vs 41 Down Slightly
Sales Per Year: 409 vs 522 Down Significantly
Median Price: $556k vs $585k Down Slightly
85260 – Zip Line Report
Sales are doing very well this year, and are up 7% over last year. The median price however has dropped 9% from one year ago.
Currently Last Year Change
Active Listings: 199 vs 192 Up Slightly
Pending Listings: 24 vs 29 Down Slightly
Sales Per Month: 47 vs 30 Up Significantly
Sales Per Year: 504 vs 470 Up Significantly
Median Price: $415k vs $457k Down Significantly
85262 – Zip Line Report
North Scottsdale’s most expensive and one of its nicest community’s, the median price is down 24% from last year. Pending listings are down as well.
Currently Last Year Change
Active Listings: 445 vs 402 Up Significantly
Pending Listings: 24 vs 35 Down Significantly
Sales Per Month: 22 vs 32 Down Significantly
Sales Per Year: 405 vs 558 Down Significantly
Median Price: $654k vs $860k Down Significantly
85266 – Zip Line Report
These very popular and upscale communities which are the North of North Scottsdale, and which is home to the newest zip code being added to Scottsdale, has seen appreciation of 8% from one year ago. Pending sales are down slightly and homes sales have dropped significantly from one year ago.
Currently Last Year Change
Active Listings: 201 vs 166 Up Significantly
Pending Listings: 17 vs 27 Down Significantly
Sales Per Month: 20 vs 16 Up Slightly
Sales Per Year: 266 vs 356 Down Significantly
Median Price: $722k vs $668k Up Significantly
85253 (Paradise Valley) – Zip Line Report
The Valley’s most upscale, prestigious, and expensive town currently has 347 homes for sales compared to 299 one year ago – an increase of 16%. Closed and Pending sales in Paradise Valley are off slightly from one year ago.
The median sales price is currently $1,763,000 having jumped significantly, as in 55%! Paradise Valley has recorded the largest median home price gain of any Arizona city.
Currently Last Year Change
Active Listings: 347 vs 299 Up Significantly
Pending Listings: 22 vs 23 Down Negligibly
Sales Per Month: 28 vs 30 Down Negligibly
Sales Per Year: 341 vs 386 Down Significantly
Median Price: $1.763k vs $1.138k Up Significantly
85268 (Fountain Hills) – Zip Line Report
Scottsdale’s most immediate eastern neighbor is accurately named for its mountain slopes and town fountain. For those wanting a small town feel, it doesn’t get much better than here. Listings and Pending listings are up over one year ago. The median price adjusted 3% lower.
Currently Last Year Change
Active Listings: 302 vs 271 Up Significantly
Pending Listings: 26 vs 14 Up Significantly
Sales Per Month: 38 vs 24 Up Significantly
Sales Per Year: 450 vs 514 Down Significantly
Median Price: $402k vs $415k Down Slightly
85331 (Town of Cave Creek) – Zip Line Report
Cave Creek has done a great job of standing strong in value. The median sales price of $461,000 is up 16% from 2013 and pending sales are down slightly from last year.
Currently Last Year Change
Active Listings: 320 vs 290 Up Significantly
Pending Listings: 33 vs 39 Down Slightly
Sales Per Month: 41 vs 56 Down Significantly
Sales Per Year: 604 vs 705 Down Significantly
Median Price: $461k vs $398k Up Significantly
85377 (Carefree) – Zip Line Report
The delightful and small town of Carefree is almost too small to accurately compare year to year stats. Having stated that, sales are way down at 73 this year compared to 110 one year ago. The median sales price increased 23% over one year ago.
Currently Last Year Change
Active Listings: 85 vs 79 Up Slightly
Pending Listings: 7 vs 4 Up
Sales Per Month: 5 vs 7 Down
Sales Per Year: 73 vs 110 Down Significantly
Median Price: $732k vs $595k Up Significantly
85086 (Anthem – North Phoenix) – Zip Line Report
These communities remind me of North Scottsdale back in the mid 90’s – newer homes with beautiful mountain views in an unspoiled northern environment. These are the bargains of the valley. Prices are so affordable and only a 30 minute drive time to Sky Harbor Airport. Prices are virtually unchanged from one year ago, with sales being down 23%.
Currently Last Year Change
Active Listings: 350 vs 344 Up Slightly
Pending Listings: 63 vs 67 Down Slightly
Sales Per Month: 71 vs 64 Up Slightly
Sales Per Year: 932 vs 1210 Down Significantly
Median Price: $273k vs $269k Up Slightly
*With thanks to Michael Orr and the Cromford Report for the Statistics used.

by MICHAEL BODEEN | Oct 13, 2014 | Bodeen Team Blog, Mike's "Real State" of the Market, North Scottsdale News, Real Estate News
When it comes to real estate trends nationally, Arizona often leads the nation statistically. We’ve seen this happen quite a bit this past decade, where in 2004 we started seeing Phoenix area homes get snatched up and home prices significantly escalate. We then watched the rest of the nation increase as well.
Market pricing peaked in August of 2005 followed by a steep decline which bottomed out in March of 2009. Foreclosures and Short Sales were the talk of the town. Investors poured into Arizona from all over to gobble up cheap homes. Flipping came to mean something much different than turning burgers.
Unfortunately, most all other states followed Arizona’s seismic downturn too. And that trend continues today. Amazingly, Arizona is now in the top five states with the lowest foreclosure sale notices. We’ve turned around, other states have not.
Previously, the rest of the nation had been watching Arizona’s prices rise and their values followed suit. Now, Arizona is falling and, in my opinion, we’ll now observe the rest of the nation’s values likewise dropping.
Current Market Trends:
Locally, our largest cities, Phoenix and Mesa still have higher median prices currently compared to last year at this time. Phoenix one year ago had a median sales price of $179,000. Today, that median has increased to $190,000 – a 6% increase. Mesa, one year ago, was $179,950 compared to $198,500 today – an amazing 10% rise. Chandler ($255,000) and Tempe ($240,000) was a no gainer and a no loser, remaining the same. So as an owner of residential real estate, you just read the good news.
The current median sales price however for most other cities is down compared to one year ago. We have been watching this change trending over the past 6 months, and now it’s official. So, how have other cities fared this past year? Here’s a few:
Anthem: $246,000 vs $245,000. Less than 1% Price Drop.
Peoria: $230,255 vs $224,900. 2% Price Drop.
Fountain Hills: $391,950 vs $382,500. 2% Price Drop.
Scottsdale: $450,000 in 2013. $430,000 currently. 4% Price Drop.
Paradise Valley: $1,517,000 vs $1,362,000. 10% Price Drop.
So the market has changed over the past two months as previous stronger markets have weakened and a few of the weaker markets are improving.
Takeaway? Sellers, be realistic in pricing. Buyers, conditions for you continue to improve. Be ready.
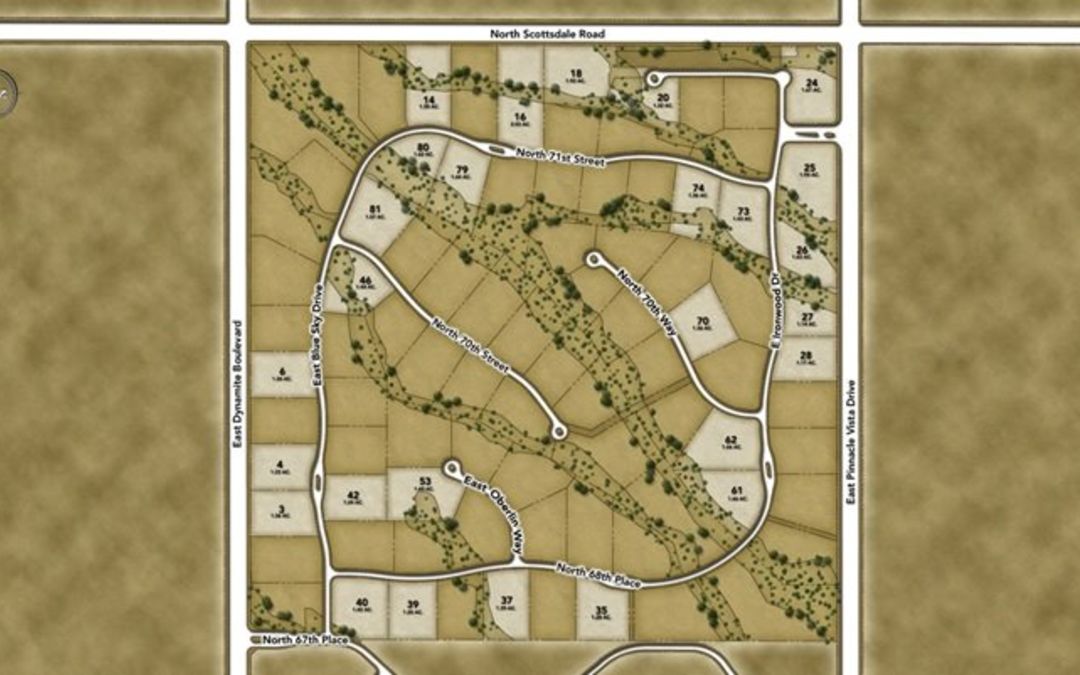
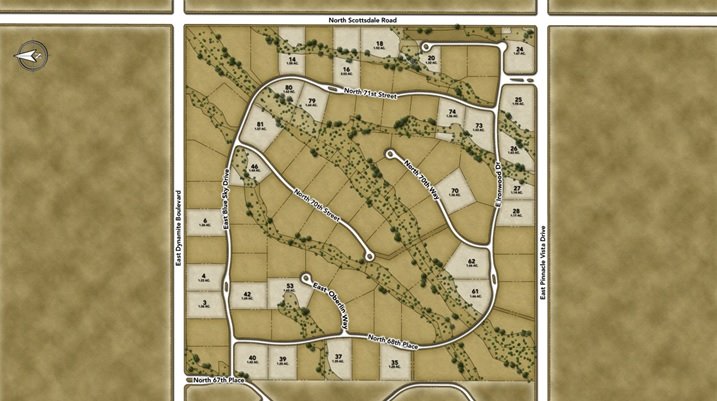
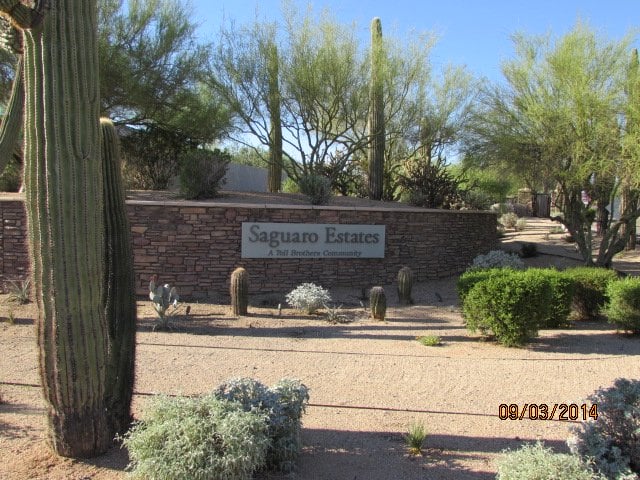
by MICHAEL BODEEN | Sep 9, 2014 | Featured Communities, North Scottsdale News, Real Estate News
Do you like gated privacy, spacious lots with generous building envelopes in a fresh newer North Scottsdale community located in the 85266 zip code? Welcome home! This serene desert community in North Scottsdale offers new homes on one acre home sites with excellent A Rated schools and lovely mountain views. It’s a short drive down Scottsdale Rd to all that North Scottsdale has to offer including world class restaurants, shopping, golf, etc.
http://www.tollbrothers.com/AZ/Saguaro_Estates
Open and large Toll Brothers floor plans are featured with Contemporary, Spanish Colonial, and Tuscan style architectural designs. 7 distinct floor plans range from approximately 3,927 square feet to 6,430 square feet. Home highlights included 3-4 bedrooms, 3.5 to 4.5 bathrooms, 3-4 car garage, media rooms, serving centers, casitas and outdoor living options.
Toll Brothers not only builds homes, but whole communities. There are a number of Toll Brother Communities in the Valley including several in the North Scottsdale and North Phoenix area. Saguaro Estates in my opinion is one Toll Brother’s crowning achievements. They are a fortune 1000 company and was recently named by Builder Magazine the 2014 Builder of the Year.
Two Toll Brother models are available onsite. Pricing begins in the low $900’s. Call Mike or Jonathan Bodeen to view this community firsthand. There are still a few good lots to choose from.
And remember, it costs you nothing to have our professional representation, but we must accompany you to the community the first time you go, or the builder is not required to pay our fee. Call us now at 602-689-3100.
North Scottsdale Zip Code Report: 85266
The 85266 Zip code, which is the most northern reaches of North Scottsdale is showing August sales to be down 29% versus 2013. The monthly median sales price in the North Scottsdale zip code is now back up to a median sales price of $620,000 compared with $605,000 one year ago and up 41% over August of 2012. Pending listings in North Scottsdale 85266 are at their lowest point since October of 2013.