by MICHAEL BODEEN | Jun 1, 2015 | Bodeen Team Blog
Last week we reported that the current Phoenix Metro Pending sales may indicate a decrease in the average sales price in the next few months – that may still be the case. But this last month registered the highest price per square foot (PSF) since August of 2008 – $130 PSF.
Since the price PSF bottomed out in 2011 at $82 PSF, there have been 42 months of consecutive increases including this last month. The peak of the market was $184 PSF back in November of 2008, so we are still well below what the top of our market reached just under 7 years ago.
Listing Supply Continues Dropping ~ Sales Looking Strong
Supply continues to fall – we have just 20,847 active listings, down another 1,000 from this time last month. Sales are looking strong – 9,319, and this is the first time we have seen a sales number over 9,000 in almost two years – June 30th 2013. Per the MLS, the year to date for all ARMLS sales is 12.5% higher than at the same point in 2014.
Foreclosure Sales Rate Drops Down to Early 2000’s
May’s foreclosures (Deed Transfer after foreclosure sale) are in the books recording 348 during May. This is amazing, and all the more so considering that in March of 2010, we hit a monthly record of 5450 deed foreclosures!
And if you figure in our extreme Phoenix Metro population growth with hundreds of thousands of new homes that were built since the 1990’s, and over a million in population growth, this is an astonishingly low number
By
Mike Bodeen
by JONATHAN BODEEN | Jun 1, 2015 | North Scottdale Zip Code Information, North Scottsdale News, Real Estate News
85254 – Zip Line Report
North Scottsdale zip code 85254, known as “The Magical Zip Code,” is showing that listings have increased compared to last summer but modestly. Pending Sales are up 33% over 2014 and likewise over 2013. Home sales have increased 17% and the median sales price increased 9% compared to 2014.
2015 2014 2013
Active Listings: 308 281 186
Pending Listings: 60 45 44
Sales Per Month: 77 66 104
Sales Per Year: 752 719 966
Median Price: $413k $378k $391k
85255 – Zip Line Report
One of the strongest and most popular North Scottsdale zip codes is 85255 and the recent numbers for these communities suggest it’s remaining so. For example North Scottsdale 85255 currently has 72 pending sales compared to 57 last year, an increase of 26%. Sales have likewise increased. The 2015 median sales price increase over last year is among the strongest in Scottsdale at 26%.
2015 2014 2013
Active Listings: 629 509 371
Pending Listings: 72 57 73
Sales Per Month: 86 74 91
Sales Per Year: 901 896 1045
Median Price: $765k $633k $685k
85258 – Zip Line Report
The Ranches and Lakes of Scottsdale which include McCormick Ranch, Scottsdale and Gainey Ranches, Lake Serena, Mountainviewlake, and the Bay Club is one of Scottsdale’s most attractive communities, especially if you like the colors of green and blue. Like North Scottsdale’s 85255 zip communities 2015 is having a strong sales year as well. With Pending home sales up 25% over last year and a sales increase of close to 10%, these special communities have soared in their median price – now at $601,000 compared with $520,000 in 2014 – an increase of 16%.
2015 2014 2013
Active Listings: 175 146 111
Pending Listings: 24 18 23
Sales Per Month: 42 38 36
Sales Per Year: 367 379 413
Median Price: $601K $520k $480k
85259 – Zip Line Report
Though you won’t hear it called this, the 85259 zip code is really “East” Scottsdale as it
2015 2014 2013
Active Listings: 258 230 157
Pending Listings: 36 33 39
Sales Per Month: 53 38 43
Sales Per Year: 426 425 501
Median Price: 663k $595k $530k
85260 – Zip Line Report
Perhaps North Scottsdale’s most central and (next to 85254) it’s most affordable zip code. The median price is pretty much mirroring August of last year, while sales were exactly the same from last year at 48 for the month.
2015 2014 2013
Active Listings: 222 215 145
Pending Listings: 32 33 37
Sales Per Month: 52 48 48
Sales Per Year: 524 481 579
Median Price: $447k $423k $430k
85262 – Zip Line Report
North Scottsdale’s most expensive and one of its nicest community’s, the median price is up slightly from last year. Pending listings are down slightly.
2015 2014 2013
Active Listings: 522 352 308
Pending Listings: 42 35 40
Sales Per Month: 40 32 42
Sales Per Year: 398 420 467
Median Price: $697k $740k $735k
85266 – Zip Line Report
These very popular and upscale communities which are the North of North Scottsdale, and which is home to the newest zip code being added to Scottsdale, has seen appreciation of almost 20% from one year ago. Pending sales and August sales are down slightly from one year ago.
2015 2014 2013
Active Listings: 274 150 121
Pending Listings: 32 18 20
Sales Per Month: 40 21 25
Sales Per Year: 279 268 374
Median Price: $650k $735k $620k
85253 (Paradise Valley) – Zip Line Report
The Valley’s most upscale, prestigious, and expensive town currently has 274 homes for sales compared to 150 one year ago. That’s interesting because usually when you get that much of an inventory increase, prices tend to go down. Not so in this case. Pending sales are way up (32 vs 18).
The median sales price is currently $1,450,000 – up a whopping 17% from one year ago.
2015 2014 2013
Active Listings: 423 301 258
Pending Listings: 38 19 24
Sales Per Month: 37 22 30
Sales Per Year: 338 352 386
Median Price: $1,450k $1.235k $1.270k
85268 (Fountain Hills) – Zip Line Report
Scottsdale’s most immediate eastern neighbor is accurately named for its mountain slopes and town fountain. For those wanting a small town feel, it doesn’t get much better than here.
2015 2014 2013
Active Listings: 175 236 193
Pending Listings: 24 21 27
Sales Per Month: 42 32 43
Sales Per Year: 367 450 531
Median Price: $601k $369k $375k
85331 (Town of Cave Creek) – Zip Line Report
Cave Creek has done a great job of standing strong in value. The median sales price of $424,000 for August is up 13% from 2013 and pending sales are about the same as last year too.
2015 2014 2013
Active Listings: 366 292 243
Pending Listings: 55 58 59
Sales Per Month: 75 56 61
Sales Per Year: 664 609 697
Median Price: $420k $424k $375k
85377 (Carefree) – Zip Line Report
The delightful and small town of Carefree is almost too small to accurately compare year to year stats. Having stated that, sales are slightly up from August 2014 at 60 – this compared to 115 one year ago. The median sales price brings one word to mind: BARGAIN!
2015 2014 2013
Active Listings: 122 114 92
Pending Listings: 18 6 12
Sales Per Month: 12 6 14
Sales Per Year: 77 87 104
Median Price: $689k $642k $773k
85086 (Anthem – North Phoenix) – Zip Line Report
Welcome to newer homes with beautiful mountain views in an unspoiled north Phoenix environment. These communities are the bargains of the north valley. Prices are affordable and only a 30 minute drive time to Sky Harbor Airport. Inventory is down from last year, pending sales are up dramatically (61%) from one year ago and the median sales price has increased by 8%.
2015 2014 2013
Active Listings: 307 376 281
Pending Listings: 106 66 101
Sales Per Month: 98 96 122
Sales Per Year: 948 936 1273
Median Price: $297k $275k $275k
*With thanks to Michael Orr and the Cromford Report for the Statistics used.
by MICHAEL BODEEN | May 24, 2015 | Bodeen Team Blog
9.6% of Loans However Remain Underwater
Homeowners with mortgages in Arizona have increasingly been improving their delinquency level which is defined as having a late payment, but not having a Notice of Foreclosure action recorded against it. As you can see from the chart below there has been a continuous downward (positive) trend which has now ranked Arizona being better off than most other states in this category.
- March 2010 = 11.3%
- March 2011 = 8.6%
- March 2012 = 6.1%
- March 2013 = 4.9%
- March 2014 = 3.8%
- March 2015 = 3.3%
Other positive news in our local post-distressed economic climate is that Lender Owned Homes:
- make up 1.9% of current listings vs 4.8% in 2013
- make up 4.9% of Pending Listings vs 12.2% in 2013
- make up 3.6% of monthly sales vs 10.4% in 2013
And Pre-Foreclosure homes (Notice of Pending Foreclosure) versus two years ago have also improved in that:
Pre-Foreclosure homes are now 5.1% of active listings vs 14.9% in 2013
- Pre-Foreclosure homes are now 7.9% of Pending Listings vs 26.2% in 2013
- Pre-Foreclosure homes are now 3.1% of Monthly sales vs 12.4% in 2013
On the not-so-good part of all this is that 9.6% of Arizona homeowners with a mortgage owe more on their home than its value. This number has been continually improving, but is still too high.
As values increase and the economy strengthens, these numbers will continue to drop. Eleven other states are worse off than Arizona with Florida leading the pack at 15.1%.
These statistics have been provided via Michael Orr of the Cromford Report via The Black Knight Financial Services.
– Mike Bodeen
by MICHAEL BODEEN | May 18, 2015 | Bodeen Team Blog
But Do Pending Sales Indicate a Leveling Off?
Sales prices rose again in the past 30 days in our Phoenix Metro communities measuring all areas and types of housing. Many are wondering if this recent rise will be a continuous surge or a momentary blip on the proverbial radar screen. Fair question.
With access to what we believe is the best real estate analytics in the nation via Michael Orr and the ASU School of Real Estate, Arizona is in a mostly enviable position to get a glimpse of what the local real estate future holds, at least in the near term. And as always, we continue to preach that “all real estate is local,” meaning whatever may be happening in the big picture of the Phoenix Metro real estate market may not be true of your neighborhood.
For the l0ng term, the Phoenix Metro real estate area seems to be moving in a positive direction. As Arizona strengthens its core job base away from home construction, which we have in years past relied on to grow, our economy could likewise grow in the health industry, bio sciences and the emerging Silicon Desert.
But here in the short term, for the monthly period ending May 15, the Valley is currently recording a sales price Per Square Foot (PSF) of $136.34 averaged for all areas and types within our MLS. This is 2.2% above the PSF of $133.42 measured April 15 and represents the second month in a row with a significant increase in average pricing.
Distressed Property Sales Continue to Decrease
Another real estate bright spot is that REO (Bank Owned) and short sales continue to decrease their market share, while “normal” or traditional property sales increased. The market share of normal sales increased from 93.1% to 93.5% over the last 30 days. REOs lost market share from 3.8% to 3.5%, the lowest since July 2007. Short sales and pre-foreclosures also lost market share from 3.1% to 2.9%.
Pending Sales Prices Slowed Last Month
On May 15 the pending listings for all areas & types showed an average list PSF of $136.08, 1.3% below the reading for April 15. This could indicate a slowing of price increases. In reviewing the average list price numbers for Pending listings, Michael Orr of ASU / Cromford Report is forecasting another slight sales price drop when those numbers are looked at in mid-June.
As Realtor professionals, like Stock market analysts, we can tend to take a micro view of the importance of short term price increases or decreases, but in the end, the most important thing is not that, but our day to day living enjoyment in our “home” rather than our investment.
What are your thoughts? Shoot us an e-mail to let us know or ask any questions.
See you next week!
– Mike Bodeen
by MICHAEL BODEEN | May 15, 2015 | Mike's "Real State" of the Market, North Scottsdale News
The Phoenix Metro Seller’s market has returned which of course means good news and bad news. We just need to first answer the question, “Are you buying or selling?” And if neither, keep reading anyway because it will help give you a lead-in to a conversation besides “Isn’t it great weather we’re having lately?” Now you can say, “Have you heard how the residential real estate market has been heating up?
How has it been heating up Mike? Since last quarter:
- Active listings are down by 6%
- Under Contract listings are up by 29% and Pending Sales are up by 28%
- Sales have increased 40% (8255 vs 5171)
- Monthly Listing Supply Dropped from 5.5 to 3.1 (39% decrease)
- Pending Price Per Square Ft (PSF) rose from $131 PSF to $137 (5% increase)
- Monthly Sales PSF rose from $131 to $136 (4% in one quarter)
First the good news for owners/sellers:
- Prices are rising hence equity is increasing
- Inventory is shrinking, Market Times are Decreasing
- Underwater homeowners may soon be above water – Choices may emerge
- Refinance options may be back on the table – Interest rates remain low
- Caveat: All Real Estate is local — the Seller’s Market news is not for everyone — yet
Now the bad news for ‘on the fence’ and future buyers:
- With rising prices you will get less house for the money or;
- Paying more for the same type house gets you a higher payment
- With less inventory you will have less choice, with more competition
- Your rents are rising or it may be getting a little too cozy living with family
- Caveat: All Real Estate is local – In some areas it’s still a buyer’s market – for now
Is there good news still for buyers? Absolutely! There are communities that are still in a buyer’s market realm, and even if you’re looking in a hot area you can still do well with a good buyer strategy. Also, mortgage rates are still low. Unfortunately, the window in that vein is closing.
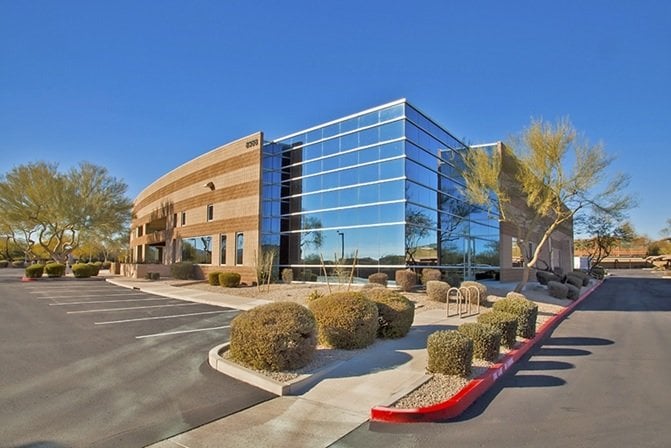
HomeSmart Opens New World Headquarters in Scottsdale
HomeSmart Realty is preparing the opening of its new 66,000 SqFt World Headquarters in Scottsdale within the 101 loop near Princess Drive and Frank Lloyd Wright (pictured below). The recent acquisition by CEO Matt Widdows will become HomeSmart’s new corporate location having just vacated the current location at 32nd St and Camelback. HomeSmart will still have a presence on Camelback, opening up a new office there as well.
The office will be split between the corporate side and the sales agents’ side. Having already been a leader of innovation and technology, we’re excited about having the latest and greatest available for the benefit of our clients. Jonathan, and I will be relocating to the new location when the office remodeling is complete – we hope shortly.
Along with the Camelback location there are 10 other offices in the Valley. One of the great perks of our business is that HomeSmart lets each professional use any office facility in the Valley as if it’s our own 24/7 utilizing a pass card.
by MICHAEL BODEEN | May 10, 2015 | Bodeen Team Blog, North Scottsdale News
Seller Patience or Radical Price Surgery – Your Choice
All real estate is local. When observing the trends and data for the Phoenix Metro real estate market, we often use all parts of the metro area (macro) and all types of housing, including single family detached (SFD), condos, mobile homes etc, though SFD is the great majority of all types.
When determining the value of a specific property, we use the “micro” approach where we pull comparable sales from the immediate neighborhood and usually up to a mile away – the same parameters most often used by appraisers.
When determining trends, we are usually safe to use the “macro” approach, because quite often the vast majority of homes fall into the similar trend of the greater. When we start to analyze the more narrow parts of the market however, we throw just about everything out the window.
We can therefore say that overall the Phoenix sales market is improving for sellers. Sales are increasing, market time is decreasing, pending sales have been increasing, and the sales price per SqFt is increasing again.
But all real estate is local. The Northeast Valley sales market in the luxury division (Over $1 Million) is far different than the under $500K market in the rest of the valley. In the NE Valley luxury market (16 zip codes) which includes Scottsdale, Paradise Valley, Carefree, Cave Creek, Fountain Hills and a few Phoenix zips, the market time required to sell a home, with one exception, are all over 300 days, and many of these zip codes require between 680 and 1100 days to sell. The market temperature description that comes to mind is ‘frigid.’
On the other hand, at the lower part of the pricing market, such as under $200,000, the market time for a number of communities is less than one month. These communities are ‘smokin’ hot. Here, sellers need to be careful not to list their homes too cheaply – they could leave money on the table.
But what if you have a pricey luxury home that needs to get sold now, (within 30-60 days) what can you do to sell that home? That’s a great question and unfortunately, there’s no guarantee it can be sold quicker unless you perform radical surgery dealing with the listing price.
In truth, a “radically” reduced price may “appear” like you’re giving away the home when in fact it may end up to be the “Fair Market Value” of the home because the great majority of the other homes for sale are significantly overpriced.
Remember, the market tells us our values. You MUST lead the market to show that your home is one of the neighborhood’s best values. To do that you must talk to your Realtor straight out and say, “Mike, you’re telling me the market time in my community is 600+ days? I don’t want to be listed in 600+ days. What is the price I need to set the house at to sell it within 30 – 60 days???
If you’ve never seen a Realtor GULP before, you will now after asking that question. Then get two other professional opinions asking the same question.
– Mike Bodeen
by JONATHAN BODEEN | May 5, 2015 | Bodeen Team Blog, North Scottsdale News
First off, apologies for the late market update! As our faithful readers know by now, the market is heating up, as is our business! Yesterday saw both my father and I running around like the proverbial headless chickens.
To evidence the rising market, and to show you the extent to which our optimism soars, take a look at some of the below facts.
APRIL SALES MARKET SUMMARY
Here are the basic ARMLS (local Multiple Listing Service) numbers for May 1, 2015 relative to May 1, 2014 for all areas & types:
- Active Listings: 21,512 versus 26,205 last year – supply down 17.9% – and down 3.5% from 22,303 last month
- Pending Listings: 7,951 versus 7,199 last year – up 10.4%– and up 1.2% from 7,853 last month
- Under Contract/Pending Listings:12,276 versus 10,584 last year – up 15.8% – and up 2.4% from 11,988 last month
- Monthly Sales: 8,363 versus 7,572 last year – up 10.4%– and up 6.0% from 7,887 last month
- Monthly Average Sales Price per Sq. Ft.: $135.88 versus $130.27 last year – up 4.3%– andup 2.9% from $131.99 last month
- Monthly Median Sales Price: $202,000 versus $190,000 last year – up 6.3% – and up 1.0% from $200,000 last month
The Take away?! Prices are definitely rising. That statistic about the average sales price per square foot is in itself a huge deal. A 2.9% increase in one month is a very good sign. Obviously that probably won’t happen every month, but it is great none the less (for sellers anyway).
We won’t break out the champagne yet though. We are heading into the peak of the buying season and there is still more than half of the year left.
– Jonathan Bodeen
Thank you (again) Michael Orr and the Cromford Report for the statistical data provided here
by MICHAEL BODEEN | Apr 27, 2015 | Bodeen Team Blog
Good News Continues for Landlords – For Renters, not so Good
More reports coming in are further demonstrating a local real estate market that continues to strengthen in a number of facets.
First off, the rental market continues to see strong demand in single family detached (SFD) listings on the market, with the number of active listings dropping further in the past month with but a 27 day supply of available rentals. The average lease listing price is $2077 per month.
The market for condo rentals has loosened somewhat with 57 days of supply, up from last month’s number of 54. The average asking list price for these rentals is now $1654 per month. Landlords are continuing to enjoy this rental market for sure.
As demand continues for rentals, this will undoubtedly push renters into the home buying market which will then continue to put upward pressure on sales prices – an interesting scenario that could have both rental and home prices increase. If this happens, it will also help the building industry, as our need for housing supply in the Valley. (See next story)
Substantial Building Permit Increase
Building permit numbers just released by the census bureau for March show that Central Arizona’s building permits recorded their highest level since 2007 with 1438 permits issued in Maricopa and Pinal counties.. This is an increase of 43% over last month!
Northeast and Southeast Valley Improves Slightly For Home Buyers… West Side Not so Much
New listings have started to arrive faster than they did last year and are up 2.1% for the quarter to date. They are up 5.4% quarter to date compared with 2013. Because we are at the height of the buying season, the additional supply is not increasing the total number of active listings. However they are not declining as they were in February and March and this will moderate the market in some areas. Unfortunately for both sellers and buyers the new supply tends to be arriving fastest in the areas that need it least. The West Valley remains very short of supply while the Northeast and many parts of the Southeast are starting to look a little better from a buyer’s perspective.
Thank you Michael Orr and ASU (Cromford Report) for the statistical data on all of the above reports
by MICHAEL BODEEN | Apr 20, 2015 | Bodeen Team Blog, Buying a Home, Real Estate News, Selling a Home
Although not great news for Phoenician buyers, sellers and prospective sellers of single family homes across the Valley can start their happy dance. For the monthly period ending April 15th, the Valley’s prices have moved up 2.1(% since March 15th. The new average sales price per SqFt is 133.49 averaged for all areas and types of housing across the MLS database, which is what we refer to as “the Valley.” Last month it measured $130.70. This is on top of a 1% increase from mid-February to mid-March.
Other indicators are also falling into line to bolster the continued strengthening of what might soon be a very active Seller’s market:
Current Listings: 22,574 One Month Ago: 22,934 (1% Drop)
Pending Listings: 8375 “ 8,048 (4% Increase)
Sales Per Month: 8368 “ 6655 (26% Increase)
Avg Market Time: 88 Days “ 95 Days (7% Drop)
Pending Sales PSF: $138* “ $134 (3% Increase)
Months of Supply: 3.3 “ 4.2 (21% Drop)
*PSF = Price Per SqFt
Based on a number of stats, including the Pending Sales price per SqFt, we can, with relative certainty see that the May report will have another bounce in values. Aside from the obvious negative buyer ramifications of rising values, further property increases will continue to release more homeowners to be able to sell who have still been underwater (home value less than mortgage debt).
by MICHAEL BODEEN | Apr 13, 2015 | Bodeen Team Blog, Buying a Home, Real Estate News, Relocation, Selling a Home
Besides some recent evidence that Millennial buyers are moving off the buying sidelines onto the real estate playing field, another block of mostly idled buyers, known as MUBs, (Move-Up-Buyers) may now be suiting up to play as well. If so, our market will continue to heat up – even more.
MUBs will be a large number of new buyers that will fill in the buying blanks of higher price ranges above those of the millennials who would typically be buying in the more affordable lower price ranges.
MUBs have been mostly inactive due to a foreclosure or short sale or not having enough equity in their home to close the sale without having to write a check. A rising market and improved credit are enabling this new freedom. As mentioned in past blogs these previous homeowners get released from the “penalty box” starting this year and will continue for an additional 2-3 years following 2015.
Importantly also is the current willingness of sellers to accept offers from buyers “contingent” on the sale of their existing home. You can thank a healthy and normalized market for that.
How do we know this is happening? Take a look at Michael Orr’s (ASU) recent Cromford Report chart comparing normal non-distressed sales under contract today (April 13th) compared with the same date last year in 2014. We can see where demand is highest:
| Price Range |
Under Contract |
Annual Growth |
| Under $100K |
587 |
-6% |
| $100K-$150K |
1771 |
+5% |
| $150K-$200K |
2440 |
+33% |
| $200K-$300K |
2940 |
+29% |
| $300K-$400K |
1389 |
+41% |
| $400K-$500K |
660 |
+35% |
| $500K-$600K |
329 |
+44% |
| $500K-$800K |
287 |
+14% |
| $800K-$1M |
118 |
+10% |
| $1M-$1.5M |
122 |
+7% |
| $1.5M-$2M |
60 |
+7% |
| $2M-$3M |
33 |
-23% |
| Over $3M |
32 |
+115% |
|
Interesting enough the lower ranges are down, but this is due to lack of inventory. Under contract homes from $150,000 to $600,000 pricing have enormously increased. The $300,000 to $600,000 (move up range) and even the $600,000 to $1,000,000 range all are experiencing double digit increases. And the market with the largest increase? Amazingly it’s over $3 Million.
For sellers, the good news continues. For buyers, the prices you see today, will be soon changing upwards. And if that happens, you’ll have the MUB’s to thank – or curse.
