by MICHAEL BODEEN | Jun 27, 2016 | Bodeen Team Blog, Real Estate News, Selling a Home
Alternate Title: The Importance of a Good Pricing Strategy
“We can always come down,” says the confident seller. This is a true statement, but there can sometimes be unintended consequences that can have a serious impact to the overall goal of selling a home for the best price and terms and in a timely manner.
“How long has this been on the market?” asks the interested buyer. In my personal and professional experience, the buyer usually wants to hear one of two responses. Either long or short. If long, the buyer’s thinking; “low-ball offer.” If short, the buyer’s thinking, “I better see this soon!”
What we know for sure:
1) More buyers will see the listing in the first 2-3 weeks of its commencement compared to any other time during the listed period.
2) If there are going to be multiple offers on a home, they usually occur in the first few days of the listing, or the first week after a good price reduction.
3) The longer that a listing is on the market, the greater the distance between the selling price and listed price.
The Phoenix Metro real estate market is currently one of the most well balanced markets in the country, which has not always been the case. In July of 2005, which was the peak of our blistering seller’s market, the average time it took to get a contract on a home was just 24 days. Contrast that with the ugly market downturn in February of 2008, where the average market time for a home to sell shot up to 140 days!
Today, the average market time is 78 days. Bear in mind that the amount of days on the market very much depends on what price range you’re in. If you’re priced under $200,000, your home should sell quickly, depending upon location. If it’s over $500,000, the length of market time increases dramatically. It’s not strange to see the million dollar+ homes sit on the market for a year or more.
For these reasons we always prefer to list the home competitively up front, so take what I’m about to say with a couple grains of salt. If you want to “test the market” with a price that is above what a professional says the home is worth, there may be away you can do so and not get burned. Well, no one can say for sure because it’s a gamble. The method we’ve used to do this, is to list a home with an automatic pre-agreed price reduction that takes place after 3 weeks down to our original recommendation. This way the seller can feel confident he/she isn’t underselling his home, but still get to a competitive price point while interest is still relatively high.
In the technologically advanced age we live in, the world of interested home buyers will see your home online before they ever decide whether or not to go see it in person. If not, they will either file it in the trash never to see it again, or perhaps save it to keep an eye on it. If the home is reduced they will then take note of it again, that is, if they haven’t already decided on different home. The best course of action for the seller is to get the home under contract during the first 3-4 weeks. In this situation the seller will most likely not be “low-balled” and still be able to obtain the best possible price.
Over the years we have seen too many sellers waste time and money because they fail to price their home correctly in the beginning, and worse than that, not reduce the price in time to still capture that initial wave of market interest. This is especially important in our current $500k+ market range where demand is low and supply is high.
by JONATHAN BODEEN | Jun 20, 2016 | Bodeen Team Blog, Real Estate News
In over 40 years of selling residential real estate, I think that I’ve pretty much seen it all. And then, a new listing comes up where I realize, I was dead wrong. This happened to me just this last Friday. I’ll just call this listing, “the Bird House.”
But first a shameless plug for a terrific listing I have near “the bird house,” as these clients of mine were the ones who asked me about the bird house. My listing (1902 E. Tamar – See pics below) is on 4.38 gorgeous elevated acres in North Phoenix. It can be split into additional parcels or just kept as a private preserve area. Terrific views. The house is one of the best built homes I’ve seen and includes 14″ thick walls with an open great-room floor-plan. Very energy efficient. Click on the picture below to get more info.

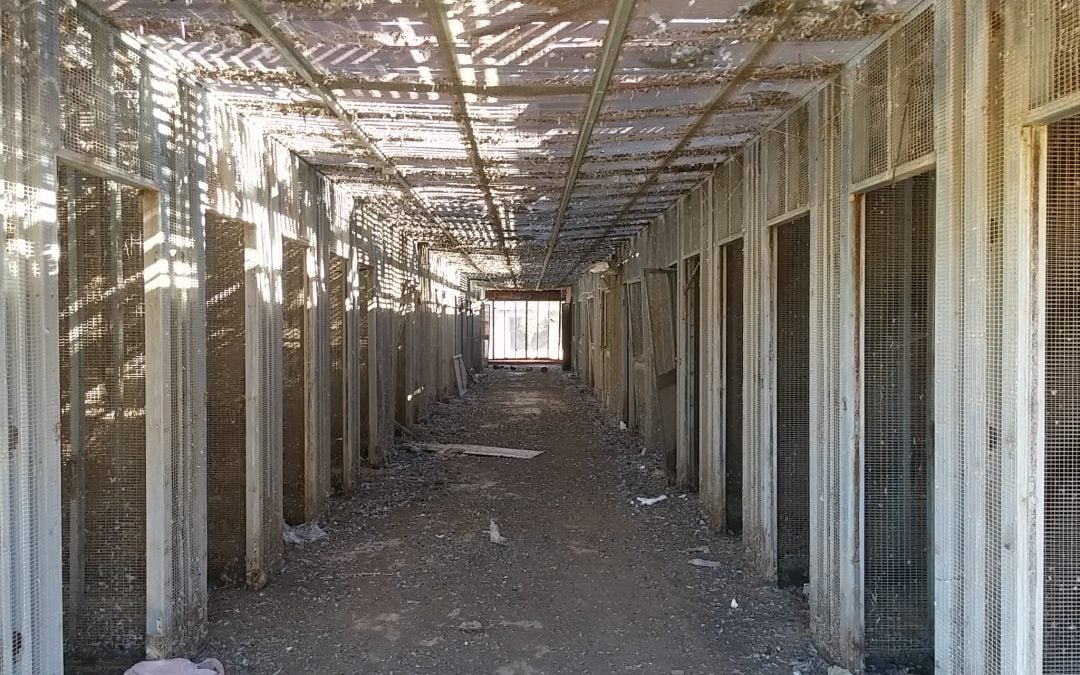
Anyway, back to “the bird house.” The listing, by a fellow HomeSmart professional, states in the remarks section of the listing, “NO ACCESS TO INSIDE OF HOUSE!!! DO NOT ENTER HOUSE!!” Further instructions say to Realtors, “DO NOT SEND CLIENTS BY THEMSELVES AND DO NOT GO IN HOUSE PLEASE!!! ACCESS AT YOUR OWN RISK.” Now, being a member of the human race, that screams out to me, “Come on in!” So Jonathan and I drove out to the home near the Desert Hills community. The gate is padlocked, but we get in via Realtor access. Walking up to the home, which was built in 1988, there were dozens of bird cages sitting outside the home. Tremendous physical damage is evident everywhere we looked.

“DO NOT SEND CLIENTS BY THEMSELVES AND DO NOT GO IN HOUSE PLEASE!!! ACCESS AT YOUR OWN RISK.”

Then we hear cooing birds as we walk in the open front door. And there’s seemingly tons of pigeon poop plopped everywhere and filth on steroids. To say it was gross would be 2016’s understatement of the year.
There is a very long barn-like structure in the back that we did not dare venture in. Dozens of stalls, the size of horse stalls were screened in, no doubt housing more birds, perhaps exotic ones. More gross.

There’s much more to the visual and aromatic. We’ve taken a few pics for you. Oh yea, the house was appraised and sold in a day for $335,000 cash. It also sits on nearly 5 acres. The appraisal estimated $45,000 for demolition of all structures
And someone lived here.
Anyone want to see my Tamar listing?

by JONATHAN BODEEN | Jun 15, 2016 | Bodeen Team Blog, North Scottsdale News, Real Estate News
A recent article from Realtor.com, our national trade organization, revealed that Americans love their pets, and especially their dogs, and even more so their dogs in Scottsdale, Arizona. Scottsdale was named one of the top ten (4th place) cities in the country for dog ownership.http://www.realtor.com/news/trends/top-10-cities-for-dog-lovers/
More and more clients these days are asking where the nearest dog park is in the community they’re considering buying into. The neighborhood where I live seems to annually request the HOA to provide a dog park even though there are miles upon miles of already existing grass and walking paths.
According to www.HumaneSociety.org, a 2015-2016 survey reported:
- There are 78,000,000 dogs in the U.S.
- 44% of all homes have at least one dog
- 50% of all pet owners own small dogs
- 66.7% of dog owners consider their dogs to be family members
- $1436 is the average amount spent on veterinary care per year
- 69% of Scottsdale homes have at least one dog
Referring to Scottsdale, the article shared this about the city as it relates to dogs:
- This wealthy suburb of Phoenix has no shortage of retirees who can spend all day with Fido alfresco. The city boasts a long list of restaurants and cafes with extensive outdoor dining for you and your furball, along with 20 bars where dogs can sit alongside your bar stool. (Don’t knock it if you haven’t tried it.)
- There’s also an abundance of pet shops that cater to petite dogs. Check out miniature frilly dresses and collars at Mackie’s Parlour, or Louis Vuitton knockoff dog toys, plush sports car-shaped dog beds, and rhinestone collars at
Oh My Dog. But please don’t go overboard-dogs embarrass easily.
Buyer beware about this! Some communities limit the number and/or size of dogs. That information is found in the CC&R’s (neighborhood rules) and is an important read even if you don’t own pets. Some clients of ours who have three dogs recently sold their home in McCormick Ranch, and purchased a home a little further north in a community that limited the number of pets to two. Our clients spoke in person with the President of the HOA about their three, and they were given approval. That’s good, because that rule could have been the proverbial deal killer.
by MICHAEL BODEEN | Jun 6, 2016 | Bodeen Team Blog, Real Estate News
The current statewide real estate agent numbers are in. And based on the swelling ranks of folks getting into our industry, business must be good! We now total just over 30,000 compared with 28,000+ one year ago. If you or someone you know is considering a real estate career in Arizona, you might have them look at the chart below. But first we need to make some clarifications to the chart.
(Chart Removed for proprietary purposes, original article written for clients only)
At the far right is the average commission based on a 6% commission per agent. It’s actually closer to half that as a 6% commission is split 50/50 with both the buyer’s and seller’s agent’s. So the average commission per agent is more like $23,000. Gross. Now a portion of that fee goes to the company, usually anywhere from 10% to 50%. Let’s assume an average of 25% fees go to the company. This will leave the agent’s share (75%) at $17,250. Gross.
Expenses. Ah yes, remember as a real estate agent no one will pay you a salary. You’re an independent contractor working solely on commissions and are responsible for all your own expenses. The good news is that you’re your own boss. The bad news is that you’re your own boss!
Expenses are, in a word, “expensive.” First there are National, State, and local Realtor association dues (assuming one belongs to a Realtor board), and many of us do. Then there are the MLS dues, which we pay for the privilege of having access to the database of all homes, lots, rentals, etc for sale. These easily total a grand per year, so now the agent’s share is down to just over $16,000.
Then we have marketing expenses including but not limited to listing expenses, photography expenses, printing expenses, errors and omissions insurance (E&O), internet/website expenses, utility (cell phone) expenses, and oh yea, auto expenses, entertainment expenses, ad nauseam.
Taxes. As an independent contractor you pay the full Self Employment tax, which is another 8+% compared to your employee brethren. And you’ll need to pay your taxes quarterly. Long story short you can figure expenses to be about half of your gross income after paying your broker/company. In our example here, let’s err on the generous side so you’ll figure your annual take home pay before taxes to be $8,500.
The number of real estate agents has increased 7% this past year which means that with sales increasing about 4%, this will leave agents with a smaller piece of the income pie.
Anyone want an application?
by MICHAEL BODEEN | May 30, 2016 | Bodeen Team Blog, Real Estate News, Realtors
Is this Good or Bad for the Consumer?
When I arrived on the real estate scene in 1976 in Truckee, California, I was a mere 22 years old. I knew nothing about real estate. While it was technically accurate to call myself a real estate practitioner, I shudder to think of all the folks I “practiced” on in those days.
So when I read these newer studies that show how Realtors are increasing in number and decreasing in age, my gut reaction is to be frightened for an unsuspecting populace. Of course back when I started, it was much harder to find quality training, education and mentorship that encouraged best practices than it is today.
According to the National Association of Realtors (NAR), the median age of a Realtor, as of 2015, is now 53. This is reduced from 57 in 2014 and is the lowest since 1952. This means a lot of younger people are joining the real estate industry.
Our local market is no exception to these statistics. We have been observing large increases in the number of ARMLS members over the past two months. This is the listing service that almost all local agents register with that enables them to hunt for homes and list them publicly as well. Today we topped 36,000 entries in this database. As recently as March 24, we saw fewer than 35,000, which is an increase of 500 agents a month! All of the largest 20 real estate brokerages except (except for one) saw increases in the number of agents as well.
So is this a good thing for Joe Q. Public? Is my gut twisting in knots needlessly? From a base economic standpoint, more laborers within a single industry creates more competition, more choice and, theoretically, lower average costs for the public to employ those agents. So from that perspective alone that can be seen as a gain to the public.
On the other hand, new agents mean inexperience, and in our industry, the knowledge we gain from experience is half our worth. A successful listing agent must also understand marketing, negotiating, and how to price a home correctly to get their clients the highest value for their property. If an agent is representing a buyer they need to know how to read a local market, and to understand the basics of lending so they can guide their client to an honest and fair lender. The 90 hours of classes you must take to become a licensed Realtor in Arizona will not give a person these skills.
My son actually began his career working for a very successful agent in Idaho as a licensed assistant in 2009. He was involved with 50 transactions from start to finish before he ever represented his first client, and I wish more agents would begin their careers this way.
It’s not that you should never work with a newer agent, because many of them are motivated, high energy, and desperate for a payday, which means they will break their back for you. The questions you need to ask are; 1. Does this agent know where to find the right answers when they are unsure of something? 2. Does the agent have a mentor/business partner they can lean on for experience? 3. Is this agent taking steps to educate themselves regularly? 4. Is this agent full time?
Fortunately, with larger companies such as our firm, HomeSmart, excellent training is made available to all agents and that’s a plus. We also have tremendous Broker Support, all of which I wished I had when I started in the biz back in 1976.
My greatest plea to a consumer searching for an agent, is not to just go with the first one you meet, which is what most do. Instead attempt to evaluate their level of experience, industry knowledge, and integrity.
by JONATHAN BODEEN | May 16, 2016 | Bodeen Team Blog, Mike's "Real State" of the Market, Real Estate News
The health of a residential real estate market can be written about in many ways, often depicting(or spinning) the author’s own viewpoint or opinion. Certainly as real estate professionals we’re prone to do this as much as anyone, so it’s best just to let the facts speak for themselves.
Home Prices Running Steady
In 2004, our local Phoenix Metro area began an upward rise in the median sales price that reached a frenetic peak in July of 2006. In January of 2001, the median sales price in the Phoenix Metro area was $128,000. Three years later it had risen to $151,000, a robust increase of 18%, or 6% per year. Then it went up 14% the next year (2005). Then it soared to its peak in July of 2006 at $260,000. I think we all agree that this price rise was NOT HEALTHY. Just as dramatically unhealthy was the market collapse that saw the median sales price drop to $110,000 in October of 2011, a frightening 58% in 5 years with most of that decrease happening in just 18 months during 2008-2009.
Since 2011, prices have been steadily rising. I realize that “steadily” is not very sexy but in fact, it beats the heck out of two up and down market flings that ruined millions across the country and hundreds of thousands in Arizona. Perhaps steadily should be the new sexy. Prices are again rising, as are rental rates, Arizona’s population is increasing again, jobs are being created, and new home construction is heading up. This is evidence (see below) of our states residential real estate health.
Foreclosures Have Virtually Disappeared.
Foreclosures, which saw hundreds of families lose their homes weekly, have swung to an amazing,almost nation leading, basement rate of .05%. Arizona ranks 43 out 51 states (including DC) for non-current loans and 49 out of 51 for homes in foreclosure. Considering that just a few years ago we were leading the nation in foreclosures, this is an amazing turnaround.
Michael Orr (Cromford Report/ASU) details how the Black Knight Financial Service Mortgage Monitor report for March shows a dramatic fall in mortgage loan delinquency over the past 2 months. There is something of a seasonal pattern in these numbers and January to March is the time of year when the delinquency rate tumbles almost every year. However, it is significant that the total delinquency rate for the USA is now at pre-housing crisis levels and the 30-day delinquency rate is the lowest in well over 15 years.
To provide some perspective, these states have the highest rate of foreclosures compared to AZ’s .05%:
- New Jersey 4.3%
- New York 3.7%
- Hawaii 3.5%
- Maine 2.7%
- Florida 2.6%
- New Mexico 2.4%
- Delaware 2.3%
- District of Columbia 2.2%
- Rhode Island 2.2%
- Connecticut 2.1%
New Construction Permits Highest in 9 Years
For the first quarter of 2016 there were 4,436 single family permits in total, up 33% from 3,333 last year and the highest number since 2007, when there were 8,710. Mesa and Chandler are the two cities with the fastest growth in new home construction while Goodyear and Gilbert are decelerating.
The top locations so far in 2016 are:
- Phoenix 656 – up 47% from 445 in Q1 2015
- Mesa 478 – up 76% from 271
- Gilbert 468 – down 1% from 475
- Peoria 374 – up 22% from 307
- Unincorporated Pinal County 358 – up 37% from 261
- Chandler 340 – up 73% from 196
- Buckeye 314 – up 64% from 191
- Queen Creek 239 up 24% from 192
- Scottsdale 212 – up 13% from 187
- Goodyear 200 – down 17% from 242
- Maricopa 200 – up 36% from 147
So without exaggerating, based on these stories anyway, we’d have to say this checkup went pretty well.