by MICHAEL BODEEN | Jul 25, 2022 | Bodeen Team Blog, Mike's "Real State" of the Market, Real Estate News
Good news continues for prospective Scottsdale and Phoenix renters who haven’t gotten much of a break over the last few years. The long-term rental supply is growing… QUICKLY! There are over 2,900 active rental listings (on our local MLS). This is an 18% increase in just one month, up from 2,463 rental listings last month.
This means that renters will have more choice with less competitive bidding. And if you’re looking for single family detached (SFD) homes to rent, those numbers are increasing the fastest. 2,088 of the 2900 total rentals listed, per the Cromford Report, are in the SFD category.
And what about rental pricing? Pricing is on the downward slide as well. The average rental asking price in the MLS is down to $1.57 per square foot (PSF), compared with $1.63 PSF last month and $1.94 one year ago.
It’s really important to get the word out to folks about the changing rental market. Many may believe that the market is what it was 6 months ago. Not so. This is a radical change occurring as we speak .
by MICHAEL BODEEN | Jul 18, 2022 | North Scottdale Zip Code Information, North Scottsdale News, Real Estate News
Terrific communities encompass the 85259 Zip Code. If we were speaking geographically abou tit we would say that it’s located in the East Central part of Scottsdale. Some folks may wonder then, why we include the 85259-zip code in North Scottsdale? The same folks rightly ask the question about 85254, 85258, and 85260 as well? After all, if you look at the long (32 miles) city of Scottsdale, you’d see it to be more central or South Central than north.
It was not too long in Scottsdale’s past (1960’s) that if you lived around Shea Blvd, that was considered “nose-bleed” country. Even McCormick Ranch (85258) was considered pretty far north from Old Town.
So the answer seems to be that for many of us who have been here for awhile, these zip code communities were a part of North Scottsdale.
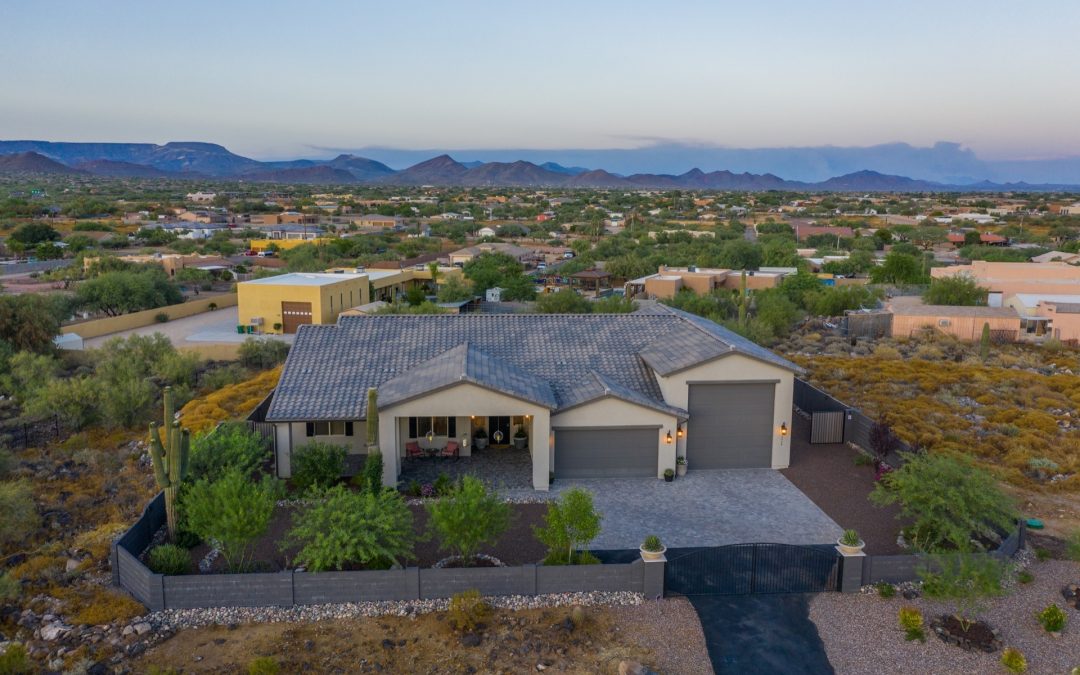
85259 Zip Code contains numerous upscale communities, such as Stonegate, The Ancala Country Club, portions of Scottsdale Ranch, Scottsdale Mountain, Cactus Gates, Rancho Trinidad, Hidden Hills, and Bella Montagna.
Mountain and City light views, terrific convenience to recreation, shopping, golf, and health facilities abound. In fact, some folks refer to the Shea Blvd N/S dividing line as the “Medical Mile” with Honor hospital and the Mayo clinic plus hundreds of all types of medical offices within a few miles.
Schools are excellent in the 85259 community which includes Desert Mountain High and Middle public school. One of the highest rated schools in the country is the Basis Charter School encompassing grades 5-12. Anasazi Elementary is another excellent choice.
As of the summer of 2022, 71 homes were listed for sale at an average list price per square foot (PSF) of $480. Under Contract listings average list prices PSF are $430, while closed median sales over the past 6 months averaged $1.085M.
Our market is changing. When updated in July, we’ll see greater listings and fewer sales, reflecting a Valley and National trend.
85259 Real Estate as of June 1st 2022
Today Last Month Last Year 1 Year Change
Active Listings: 71 60 66 +08%
Listings Under Contract 49 48 60 -18%
Sales Per Month 42 55 57 -26%
Sales Per Year 541 556 598 -10%
Months of Supply 1.1 0.7 0.7 +4 Months
Annual Appreciation Median 23% 21% 19% -4%
Median Annual Sales Price $1.085M $1.050 $880K +23%
Considering Buying or Selling in North Scottsdale or the Northeast Valley. Give Mike a call at 602.689.3100 or send an email to: [email protected].
by MICHAEL BODEEN | Jul 18, 2022 | Bodeen Team Blog, Mike's "Real State" of the Market
The “short-term” outlook for our Phoenix Metro residential real estate market seems determined to continue a steep drop in sales and a downward adjustment of pricing. This is due to the meteoric rise in listing inventory caused in large part by the doubling of mortgage rates in less than a year along with the huge rise in home values. As usual, most of our data supplied is with much thanks to The Cromford Report.
First, we must look at the supply of unsold listings. We have 15,500 active listings currently unsold. The inventory market peaked, or in this case, shall we say, bottomed out, in March which had about 4500 listings. This translates to an increase of nearly 250%. While we are still lower than the long term average in terms of total active listings, that could change soon at the current rate of change.
The number of downward weekly price changes is astounding. Historic. At the beginning of the year, the number of weekly price changes were under 400. For the week ending January 30th, for example, there were 374 price changes. Less than 6 months later, this last week, has seen 3703 listing price reductions. That is a 900% increase! (See Chart below)
And what about pricing? Though it’s still early before we can really get a firm grip on this, we can nonetheless already see downward pricing movement. Remember, final sales price, or final sales price per square foot (PSF) is a lagging indicator. The monthly average PSF peaked at $306 on May 22, 2022. Within two months, it’s dropped to $290 PSF, or 5%. With the record number of price reductions happening, we can count on a additional downward pressure on values.
Well Mike, what’s the “mixed” part of the message? Looks like a seller’s downer to me. Glad you asked, I think.
Based on current listings that are in a “pending” status, which means they are under contract, in escrow, Cromford is predicting a short-term bump in values to $295 PSF, due to current higher priced of the homes under contract. But this is short term.
by MICHAEL BODEEN | Jul 11, 2022 | Bodeen Team Blog, Mike's "Real State" of the Market, Real Estate News
In a rising and heated sales market, almost any agent can look like a genius sales guru. You may mess up inputting your data into the MLS, you could take house photos with a 10-year-old cell phone, you could fail to follow up with phone calls to your client, fellow agents, and the buying public, and not even get a “for sale sign” on the property for 5 days, and still, you’ll be deluged with a dozen or more offers on the property, with many of them over asking price. Agent is hero. And sadly, many of these “agents” believe their own self-imagined press releases.
It’s been a market where gimmicky sales approaches will thrive, then dive. 5 Star agent google ratings will plummet from the skyscraper to the basement – assuming they are ever shown to the public. If you thought you weren’t hearing from your agent very often before, you ain’t seen nuthin yet.
Advantage of Experience and the Longview
One advantage of having been an active and productive real estate sales professional for over 45 years is that I’ve seen it all – that is until the next thing that I’ve never seen before comes along. These days, that could be yesterday. 😉
But now the market is changing. Supply (listings) are rising quickly, (see chart below). Demand is diminishing. Pending sales, closed sales and listing prices are dropping.
“And as a sure sign of the Apocalypse, builders are cuddling up to Realtors to get us to bring our buyers back to them.”
We’re now seeing layoffs happening. Re/Max, one of the largest franchises in the country is laying off 17% of their support staff. (https://www.marketwatch.com/story/remax-to-cut-17-of-its-workforce-2022-07-07) The mortgage industry has now laid off hundreds of thousands of jobs nationwide. Title companies are shedding thousands of jobs. And as a sure sign of the Apocalypse, builders are cuddling up to Realtors to get us to bring our buyers back to them.
https://www.mansionglobal.com/articles/what-real-estate-industry-layoffs-could-mean-for-u-s-housing-markets-01657278554
by MICHAEL BODEEN | Jul 3, 2022 | Bodeen Team Blog, Mike's "Real State" of the Market
Before we engage in our Phoenix Metro market discussion, let’s take a look at June’s stats to get you somewhat up-to-date, though with the way the market’s so quickly moving, we might be out of date before the fireworks fly this evening. And oh, by the way HAPPY 4TH OF JULY!!!
Compared to last year at this time, listings are up 153%. Listings under contract have dropped 16% from last month and are down 24% versus a year ago.
According to the Cromford Report, “The rise in supply has been faster than ever seen before…the change in demand was equally stunning.” Compared to last year at this time, listings are up 153%. Listings under contract have dropped 16% from last month and are down 24% versus a year ago. In addition, monthly sales are down 21% from one year ago, and 8% compared with last month. That monthly sales number will drop more next month.
Keep in mind, that “pending” and “sold” stats are “lagging indicators.” Pending deals went under contract over the past several months, and a number of them had “locked” mortgage rates that enabled them to close at a lower than current lower rate. Sold deals went under contract 3-4 months prior to now. Next month and beyond we’ll see more of the reality of the market.
One segment of the market, per Cromford, that has upheld sales has been the iBuyer market, which are large companies (Offerpad, Opendoor, etc) still buying. This will, or should change, or we’ll see continued heavy losses by these companies. These companies create two deals for each house they buy, as they turn around to try and quickly sell it. This contributes to a higher skewing in sales numbers.
Builders are again being nice to Realtors, inviting us to bring our clients their way which is a stark difference over the past few years. They’ve gone from rationing their product only a few months ago to needing incentives such as mortgage rate buy-downs to coax buyers to sign up or keep their existing orders. Alas, there is nothing new under the sun.
According to Cromford’s “Contract Ratio,” our market has now entered the top of the “balance range.” At the current rate of downward speed, it’s anyone’s guess if (when) we re-enter a “buyer’s market,” but it’s likely to happen sooner than later.
by MICHAEL BODEEN | Jun 27, 2022 | Bodeen Team Blog, Mike's "Real State" of the Market, North Scottsdale News
Mortgage rates may determine how long our (national and Phoenix) current downturn will last. The cost of living, or inflation, may determine interest rates. Lenders don’t make money by loaning to us at less than the rate of inflation. Which is why we always felt that the greatest deal around was a fixed rate mortgage because we were paying the lender back with inflated dollars.
For the average borrower, the current 30-year mortgage rate is now at 6% – assuming you have a mid-700 Credit score or above. For a 50 year context, prior to 2022, the national average mortgage rate from 1971 has been? Jackpot: 7.77%! They have been less than that since 2001. (See Chart below)
“Jim, if rates EVER get below 13% again, we’ll be rich!”
When 30 year mortgage rates were uber cheap, as in before February of this year, and for most of the last 10 years, we Realtors and lenders were living in a most unreal world of cheap rates. Most of my younger colleagues, and certainly those who have been in the business for less than 10 years, would oft roll their eyes when I talk about the good and not-so-good old days, prior to this millennia. And as long as we had a market in balance, all was good.
But alas…
So here we are in 2022, our 6% rates slowing (stopping?) our market. I don’t have any numbers about Realtors leaving the business yet – we’ll know more about that at year’s end when we have to cough up our annual board, MLS, and Realtor dues for 2023. But on the mortgage end, over 75,000 mortgage related jobs nationally have been cut, and lenders are just getting started slicing and dicing. It started last year with the refi market dropping and is now in full swing with purchase apps plummeting.
Will we see 3% Rates Ever Again?
Will we see 3% rates ever again? Only the Lord knows that one, but if we did, it may not be too healthy for us. Honestly, the 5%-6% range may be the real sweet spot. Think about it. How was our market doing at 3%? How was it for first time home buyers as they competed with institutional and private investors who soaked up much of the new inventory of homes coming on the market causing the market to inflate to unsustainable prices?
One of the benefits of our rising market might be the slowing of buyers buying as landlords because the market numbers no longer make economic sense. But, you say, buyers will have to pay a higher monthly payment. Yes, but how would a 6% mortgage look compared to a 7%, 8%, 10% or more rate?
Remember, for long term rates, inflation is the key metric. Look again at the chart, half that chart (25 years) is above the near 8% long term average. I remember saying to a former friend and colleague of mine in Truckee, California in 1984, Jim Orebaugh, “Jim, if rates EVER get below 13% again, we’ll be rich!” No one can tell me or you how high inflation will go!
You say, Mike you’re not an economist, what do you know? You got me there. After all, economists have forecasted nine out of the last five recessions😉
by MICHAEL BODEEN | Jun 24, 2022 | North Scottdale Zip Code Information
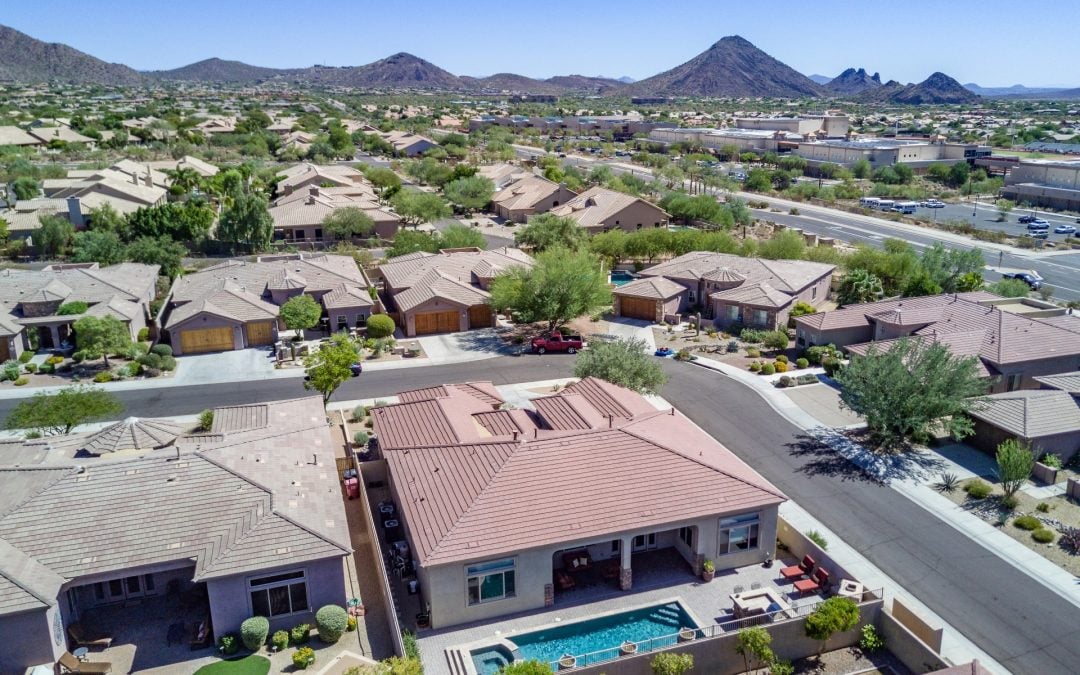
Do you like water? Lakes? Golf? Mountain views? If so, then this North Scottsdale zip code (85258) is for you.
The 85258-zip code was primarily built around several key and lush massive planned unit developments, with nationally acclaimed McCormick Ranch starting things off in the 1970’s. Lush greenbelts, lakes, lots of foliage, golf, retail shopping and dining, and still close to the popular Downtown (Old Town) this community struck popularity pay dirt. Partially vaulted ceilings, and step-down living rooms were all the rage.
McCormick Ranch is located west of the Loop #101, whereas Scottsdale Ranch is built east of the #101.
Seeing the amazing success with McCormick Ranch, Scottsdale Ranch next appeared on the scene during the 1980’s. Many lakeside developments grew up in Scottsdale. Wide streets and sidewalks became an absolute sporting mecca for walkers, joggers, and cyclists. Combined with McCormick Ranch, these bike/walking paths from Scottsdale Ranch and McCormick Ranch weave all the way down near Tempe, without having to cross a major road. Generous under road tunnels dot the landscape. It’s amazing.
Following the “Ranch” tradition, palatial Gainey Ranch sprung up in the 90’s. Gainey is a first-class resort-like gated community developed west of Hayden Road. Preferred by many elites, especially local professional sports icons, Gainey Ranch tempts with privacy, greenery, lakes, golf, tennis, etc. The Hyatt Regency Scottsdale Resort and Spa is located within Gainey Ranch.
Considering Buying or Selling in North Scottsdale or the Northeast Valley. Give Mike a call at 602.689.3100 or send an email to: [email protected].
In short, the Valley’s residential real estate market is in a full course reversal. The terrific 85258 North Scottsdale neighborhood is no exception. As you can see by our recent numbers, active listings, the lack of which, has been our serious market problem for buyers over the last few years is now climbing, having doubled in one year. More amazingly, this community’s inventory has risen over 50% in one month.
Annual sales per month have dropped 37%, yet incredibly, like most North Scottsdale neighborhoods, the median price has continued to rise, reaching $1,015,000 – an increase of 23% over last year at this time.
What Do We advise?
Seller’s, if you’re trying to catch the top of the market, you may still have some time, though time is not your ally. There are still a number of buyers looking specifically for this community.
Buyer’s, you have more inventory to look at. You may also have more negotiation room than you’ve had for over two years. Don’t be intimidated by a new home on the market. If you hve cash or a strong down payment, your offers are strong.
by MICHAEL BODEEN | Jun 20, 2022 | Bodeen Team Blog, Mike's "Real State" of the Market, North Scottsdale News
Not easily forgotten is the winter of 2020, which emerged the reality of a worldwide pandemic not seen in my lifetime. In February 2020, appreciation in the Phoenix and Scottsdale Area real estate market was nearly 10%. There was a six-year period from 2014 to 2020 that had annual appreciation averaging around 5%. That was a normal market.
And then, the pandemic hit. As you can see by the chart below, right after that February, coinciding with the pandemic, immediately the annual (based on monthly) appreciation dropped in March to 8.5%, April to 6.8%, and May to 4.5%. In the midst of this new pandemic, everyone – yes, everyone, expected this to happen – and worsen.
But then, the incredible unforeseen happened. Our market, as well as most metropolitan markets in the U.S., began to soar. Demand took off. Listing inventory, after a brief increase in that 2020 winter, began dropping. Multiple offers and bidding wars became the normal storyline – everywhere. By October of 2020, the annual appreciation rate based on Monthly Price Per Square foot (PSF) hit 19.1%. In February of 2021, that rate was up to 23%. In April it increased to 32%, and it peaked at 38.4% the next month (May 2021).
One year later, as the pandemic is normalizing, folks are now doing what we thought they’d do at the beginning of the pandemic – sell in droves. More listings have been added (11,845) to the Arizona Regional Multiple Listing Service (MLS) in the past 4 weeks than any other 4-week period in the history of the Phoenix MLS, per the Cromford Report.
We are currently getting 34% more new listings than average every 28 days. If this rate continues, it is estimated that a balanced market will return this August. Some of our cities are close to experiencing that balance now.
All this is good news for buyers. What’s not been good news of course is the escalation of mortgage rates – now in the 6% range. Someone reminded me the other day that my real estate career goes back to the 18% mortgage rates in the 80’s. Of course, the huge difference between now and then is the high price of current housing. 18% mortgage rates, which of course halted real estate sales then, happened when the U.S. home median price was under $90,000.
Are we in a meltdown, or will the market pull up? Our counsel to buyers is to take advantage of more homes on the market to find that right one. When inflation gets tamed and comes down to acceptable levels, this market will again change. When will inflation get tamed? That’s the question before us.
by MICHAEL BODEEN | Jun 14, 2022 | North Scottdale Zip Code Information
The 85255 North Scottsdale Zip Market: What’s Happening Now?
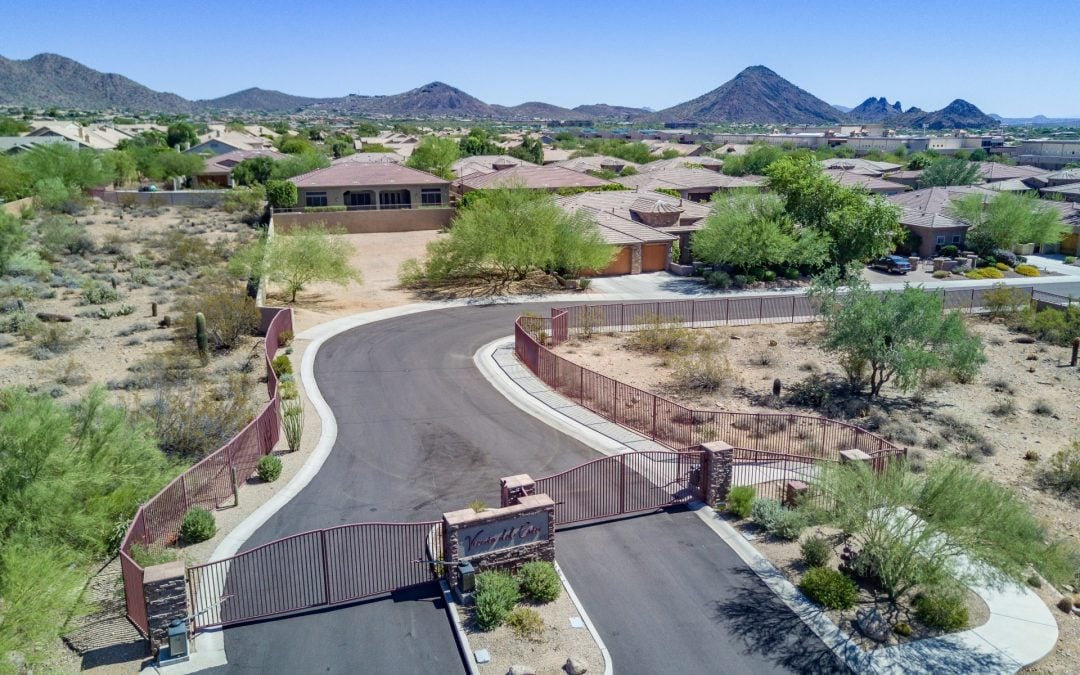
The 85255 seller’s market is retreating from the fevered sales pitch of this past year. Though listings are still less than one year ago, there’s been a considerable increase from last month. Across the board in most all areas and price ranges, listing supply is increasing. In one month the 85255 Zip Code listing supply increased by over half.
Appreciation is showing a 30% increase and 6.5% over last year, but less than the 33.5% from last month.
Considering Buying or Selling in North Scottsdale or the Northeast Valley. Give Mike a call at 602.689.3100 or send an email to: [email protected].
SERENO CANYON RELEASE
Check out Toll Bros new release in Sereno Canyon, a beautiful and natural community in North Scottsdale’s 85255 zip code. Check out the community from this link:
If you would like to fill out the Pre-Application process, be sure to add Mike Bodeen of HomeSmart as your buyer’s agent, if you’re not currently working with a local professional.
Considering Buying or Selling in North Scottsdale or the Northeast Valley. Give Mike a call at 602.689.3100 or send an email to: [email protected].
by MICHAEL BODEEN | Jun 13, 2022 | Bodeen Team Blog, North Scottsdale Schools, Real Estate News
If you’re a Star Wars junkie, like my son and business partner, you might get a chuckle from today’s Snapshot Heading.
If not, then what I’m referring to today is that our Phoenix Metro real estate market is reversing course, cooling its (X-Wing Starfighter) jets from a rabid seller’s market to a potential state of normalcy. And it’s happening rapidly.
The Cromford Market Index, which measures the balance of supply and demand (defined as between 90-110) in our market, in the first week of January, stood at 474 – its peak for the year. Today, less than 6 months later, it has dropped to 237 – exactly by half! And our lightspeed (faster than the speed of light weirdly enough, per Wookieepeida), descent from the heights does not seem to be abating, least not yet.
And before I get myself into more Star Wars vernacular battles with Jonathan, I’d better pull up😉
In related news, the Phoenix Business Journal released an article today (link below) about the dramatic cost-of-living increase in the nation and Phoenix Metro. The cost-of-living index in the Valley has increased over 24% in the last 3 years, far out-pacing the national average of 9.76%. And nationally, as well as locally, the article stated that the “recent surge in gas prices wasn’t accounted for in the report.”
Honestly, there needs to be a retreat or sustained leveling off in housing prices, both rentals and purchases. Yes, as property owners we love to see our home-equity/net worth increase, but on the other side of the equation, buyers and renters could use a break.
“as property owners we love to see our home-equity/net worth increase, but on the other side of the equation, buyers and renters could use a break.”
Jonathan and I were discussing this matter last night, and both of us are concerned that Phoenix and Arizona are on a business growth path that has, and probably will continue to change the affordability landscape for years to come. What we’re seeing is the immensely high rate of growth in new business (e.g., TSMC) and start-ups, plus the growth of many existing businesses (e.g., Intel) throughout the region and state.
Of course, Phoenix and Arizona are not alone. This is a national problem. The highest cost of living increase in the country is Dayton, Ohio. And smaller cities such as Bozeman, MT and Cape Coral, FL, have some of the largest cost of living spikes as well.
But the cost of housing is at the center of our economic universe, and something’s got to give. Real estate balance would be a great place to start.
May that force be with us.